Detailed guide

At A Glance

The yearly operating board for comparing target pace, project delivery timing, and commercial movement month by month.

At A Glance is the portfolio signal board. It is where yearly intent, month-level progress, and project-level execution are read together so you can intervene early instead of discovering drift in month-end reporting.

Quick summary

  • Run a weekly scan to spot month clusters where too many projects converge on the same delivery window.
  • Compare Goal to Date versus Collected Revenue before deciding whether the portfolio issue is demand, execution, or billing.
  • Use project-row patterns to prioritize which project detail reviews happen first in the operating meeting.
  • Toggle Freeze column when scanning later months so project identity stays visible during horizontal review.
  • Move directly to Project Detail for rows showing low progress or inconsistent commercial movement.
  • Use year navigation to compare whether current portfolio shape is improving or repeating prior-year risk.

Put it into practice

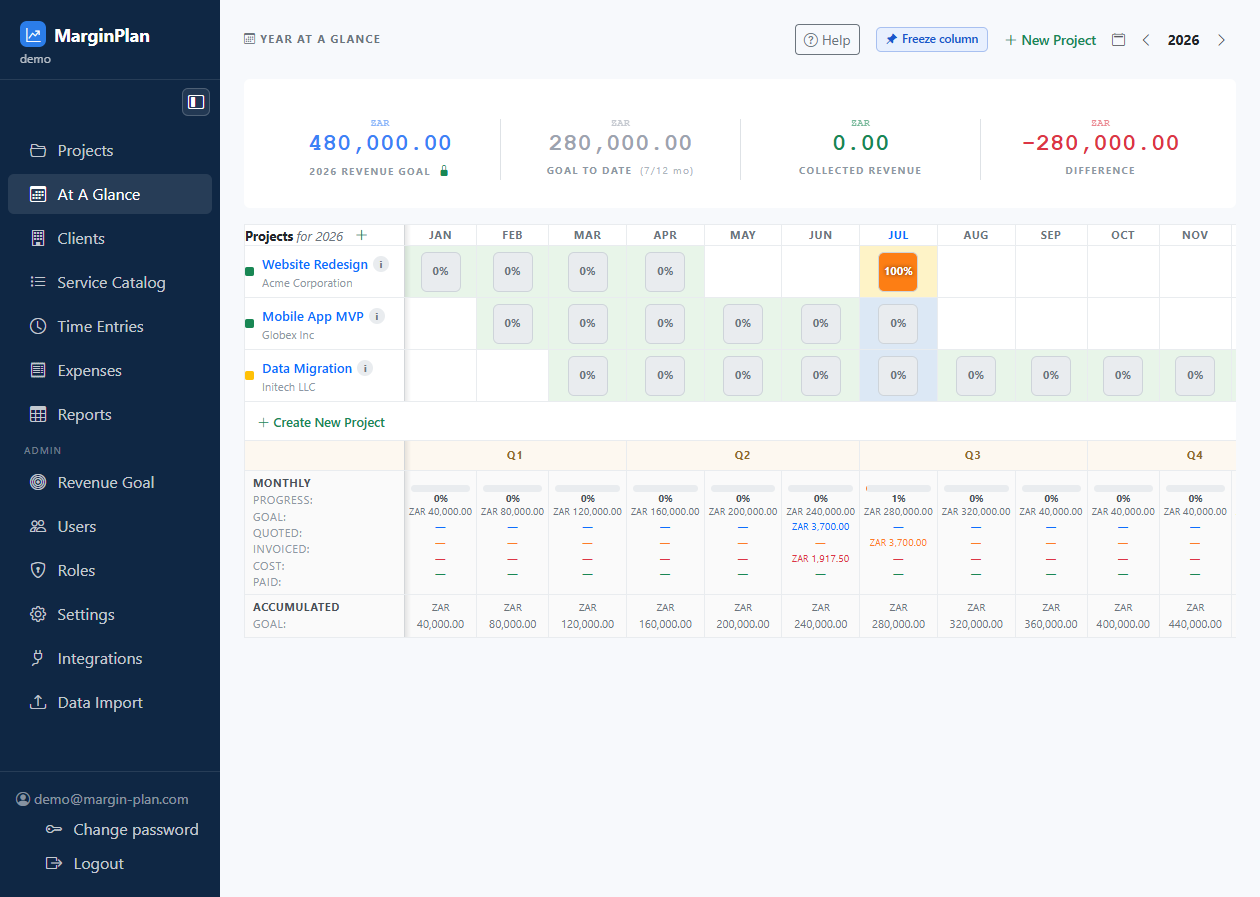
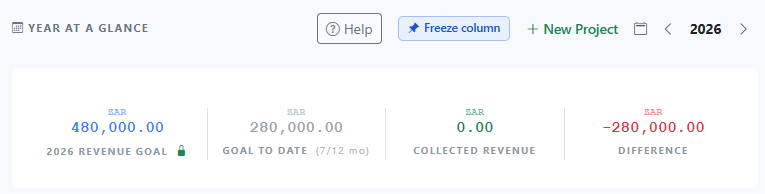
  1. Start by confirming the year you are reviewing, then orient the page controls. Make sure the header year, Help, Freeze column, and New Project actions are visible before reading the data.

    InteractionsAt A Glance header: verify year label and action buttons in the top-right control rail.
    Start by confirming the year you are reviewing, then orient the page controls. Make sure the header year, Help, Freeze column, and New Project actions are visible before reading the data.
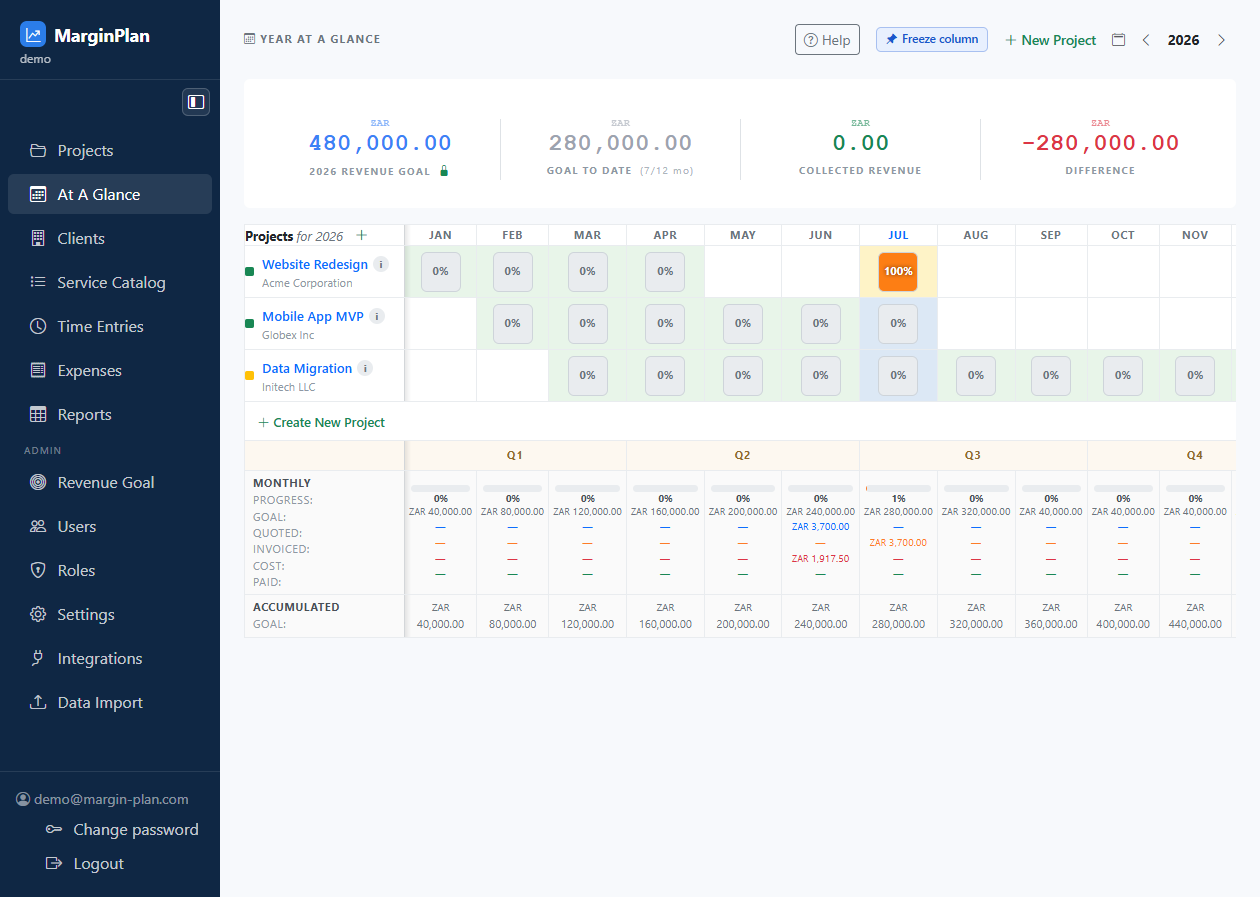
  2. Read Revenue Goal, Goal to Date, Collected Revenue, and Difference first. This tells you whether the portfolio is ahead, on pace, or behind before you diagnose individual projects.

    InteractionsAt A Glance summary cards: review the four KPI cards directly under the page title.
    Read Revenue Goal, Goal to Date, Collected Revenue, and Difference first. This tells you whether the portfolio is ahead, on pace, or behind before you diagnose individual projects.
    Open workflow: Revenue Goal
  3. Scan the project timeline rows across months to find pattern risk: stalled work, late concentration, or uneven progression that can threaten delivery and margin.

    InteractionsProjects table: read project rows left-to-right across Jan-Dec month columns.
    Scan the project timeline rows across months to find pattern risk: stalled work, late concentration, or uneven progression that can threaten delivery and margin.
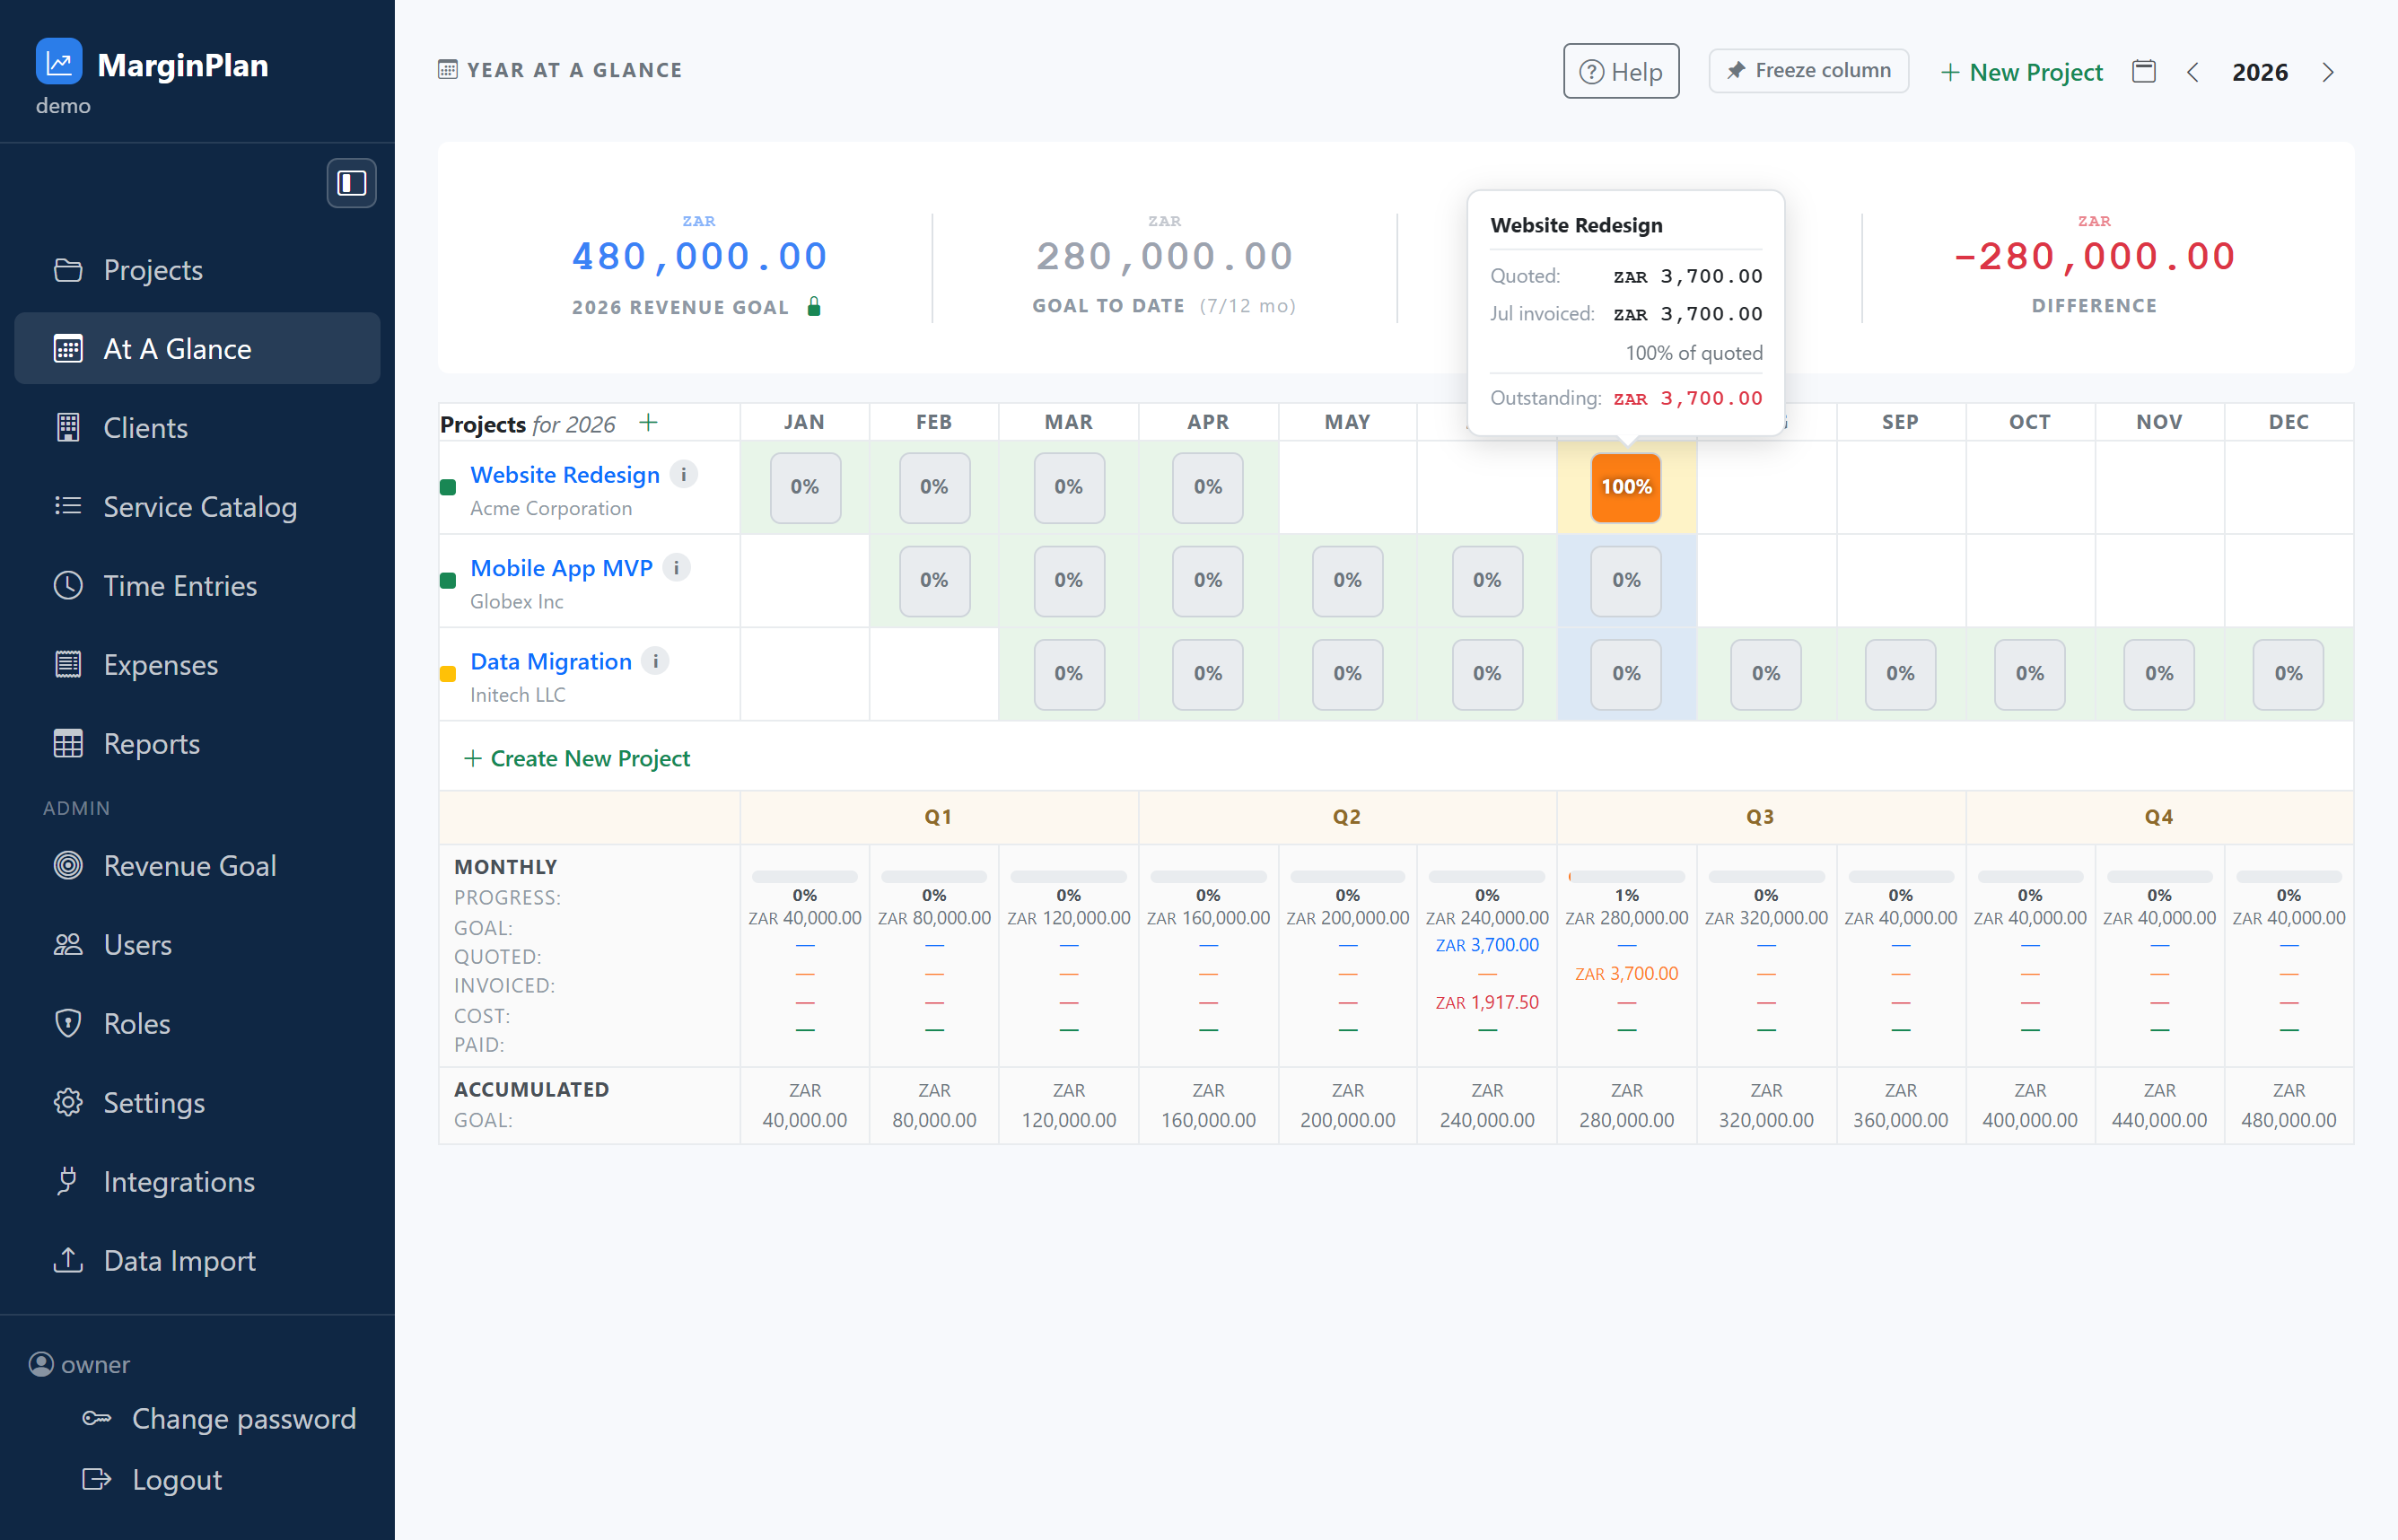
  4. Use the Monthly Progress row to compare Goal, Quoted, Invoiced, Cost, and Paid by month. This isolates whether the gap is pipeline generation, invoicing lag, or cash collection lag.

    InteractionsBottom summary row in the timeline table: inspect Monthly Progress cells for each month.
    Use the Monthly Progress row to compare Goal, Quoted, Invoiced, Cost, and Paid by month. This isolates whether the gap is pipeline generation, invoicing lag, or cash collection lag.
    Open workflow: Reports
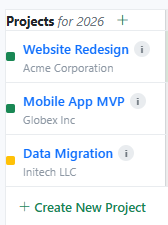
  5. Keep project names fixed during wide timeline review so month-by-month interpretation stays accurate. Use Freeze column when you need to scroll horizontally through later months.

    InteractionsAt A Glance header: click Freeze column before scanning far-right month columns.
    Keep project names fixed during wide timeline review so month-by-month interpretation stays accurate. Use Freeze column when you need to scroll horizontally through later months.
  6. Drill into the project that explains the biggest risk signal. Open the project name from the timeline row and validate scope, cost, and billing state in Project Detail before deciding corrective action.

    InteractionsProject timeline row: click the project name link to open Project Detail.
    Drill into the project that explains the biggest risk signal. Open the project name from the timeline row and validate scope, cost, and billing state in Project Detail before deciding corrective action.
    Open workflow: Project Detail
  7. Create new projects, use the 'New Project' from the header or table.

    InteractionsAt A Glance page: click New Project in the top action rail, in the table header row or the last row before the monthly stats.
    Create new projects, use the 'New Project' from the header or table.
    Open workflow: Create Project

What to review

Year header and action rail

Combines Help, Freeze column, New Project, and year navigation so you can keep context while switching focus or planning horizon.

Revenue goal summary cards

The top cards (Revenue Goal, Goal to Date, Collected Revenue, Difference) are the first checkpoint for pace health before project-level diagnosis.

Projects-by-month timeline grid

Each project row shows month activity and progress percentages so you can spot delivery concentration, inactivity, or late-stage bunching.

Project financial hint trigger

The info marker beside each project name gives quick financial context so you can decide whether to drill deeper immediately.

Monthly progress strip

The monthly summary row compares Goal, Quoted, Invoiced, Cost, and Paid so pacing and cash movement can be reviewed across the year in one pass.

Project links and create shortcuts

Project names open Project Detail directly, and New Project shortcuts in the toolbar/table let you add planned work in the correct year context.
Guardrails

  • Yearly goal cards should reconcile with approved planning assumptions; if they do not, correct target context before interpreting project variance.
  • Month-cell progress interpretation is only valid when project dates and statuses are current in the underlying project records.
  • Quoted, invoiced, cost, and paid comparisons should be reviewed together; acting on one metric in isolation often creates false diagnosis.
  • Create-project decisions from this page should reflect capacity and timing reality, not just revenue pressure in one month.
  • If project-row signals conflict with Project Detail facts, trust the detailed record and fix stale timeline inputs promptly.
  • Users need project-view access for the represented records; otherwise timeline diagnosis cannot be completed end-to-end.
  • Portfolio scanners may have view-only rights while project managers hold edit rights for corrective actions.
  • Revenue-goal context may be visible but still require admin permissions to update planning assumptions.
  • New Project actions are permission-gated and may be unavailable for read-only operating roles.

If it starts drifting

  • If the timeline seems sparse, verify the selected year and confirm projects in scope actually overlap that year.
  • If monthly progress numbers look contradictory, inspect quote/invoice/time-entry completeness before assuming a UI defect.
  • If a project appears healthy in timeline but unhealthy in delivery reality, open Project Detail and correct stale dates or status values.
  • If the Difference card is persistently negative, review whether the issue is low quoting activity or invoicing/collection lag before changing pricing strategy.
  • If project names become hard to track across later months, use Freeze column before drawing conclusions from right-side cells.
  • If you cannot drill into a project from the row link, confirm your role includes visibility to that project record.